Big Data Icons Set: A Practical Tool for Visualizing Complex Information
If you have ever tried to explain what big data means to a client, a colleague, or even your team, you know how quickly things can get abstract. Numbers, flows, pipelines, storage, analytics—each concept is layered. That is where a well-designed Big Data Icons Set becomes more than just a collection of visuals. It becomes a bridge between complexity and clarity.
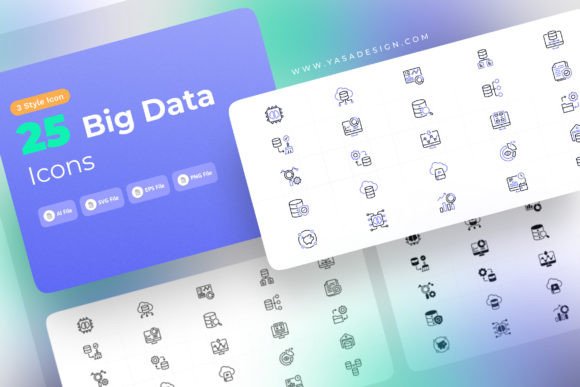
The Big Data Icons Set discussed here includes files in AI, SVG, EPS, and PNG formats. It offers 25 unique icons across three distinct styles: line, solid, and flat color. These icons are ready to use, fully editable, and come with organized file and layer structures. But what does that actually mean for someone like you, who might be building a presentation, designing a dashboard, or putting together an infographic for a data-heavy project?
Let us walk through real situations where this icon set makes a tangible difference.
Why a Big Data Icons Set Matters in Everyday Work
Icons are not decorative extras. They are functional tools that help people process information faster. When you are working with big data concepts, your audience might not have the same technical background you do. A well-chosen icon can communicate an idea in a split second—something paragraphs of text struggle to do.
Consider a business analyst preparing a quarterly report for stakeholders. The report includes sections on data ingestion, storage optimization, real-time analytics, and predictive modeling. Without visuals, each slide looks like a wall of text. With icons from a dedicated set, each section gets a visual anchor. The stakeholder immediately sees which part of the pipeline you are talking about, without needing to read every line.
The same applies to product managers who need to communicate technical roadmaps to non-technical teams. A flat color icon representing a data lake or a stream processing node can make a roadmap slide instantly readable.
Three Styles for Different Contexts
One of the practical strengths of this Big Data Icons Set is that it comes in three styles. That is not just a nice-to-have. It solves a real problem: the same icon might need to behave differently depending on where you use it.
Line style for clean documentation and wireframes
When you are designing a white paper, a technical document, or a wireframe for a data platform, you do not want heavy visuals competing with the content. Line icons integrate smoothly. They stay subtle and professional. I have seen teams use them in internal documentation for data engineering workflows, and the result is a guide that feels polished without being distracting.
Solid style for dashboards and UI elements
If you are building a web application or a dashboard that displays big data metrics, solid icons work better. They hold their shape at small sizes, which is critical when you have limited screen real estate. A solid icon for a database or a server cluster remains legible even when it is scaled down to fit into a filter bar or a navigation menu.
Flat color for presentations and infographics
Presentations and infographics thrive on color. The flat color style in this set gives you a consistent palette that does not look overly saturated or cartoonish. When I worked on a visual report about customer data trends, using flat color icons helped distinguish between data sources, processing steps, and output visualizations. Each stage of the pipeline became instantly recognizable.
Real-World Scenarios Where This Icon Set Shines
Let us move beyond general examples and look at specific situations where this icon set proves its value.
Scenario 1: A startup pitching to investors
Startups often have limited design resources. Founders need to create pitch decks that look credible and professional. If your startup is building a data analytics platform, having a cohesive icon set means you can illustrate your technology stack without hiring a designer. You can drop a line icon for data ingestion next to a solid icon for storage, and a flat color icon for the visualization layer. The result is a deck that feels intentional, not thrown together.
Scenario 2: A marketing team creating educational content
Marketing teams produce blog posts, social media graphics, and ebooks about big data trends. A flat color icon of a data flow can turn a boring statistic into a shareable visual. I have seen teams use these icons to break down complex concepts like data lakes versus data warehouses in a way that resonates with a broader audience. The icons act as visual shorthand, making the content accessible to people who are not data engineers.
Scenario 3: A data science team building internal tools
Internal tools often suffer from poor UI because the focus is on functionality. But adding consistent icons to a tool used daily by your data science team can improve navigation and reduce cognitive load. A solid icon for a query builder, a line icon for a data export function, and a flat color icon for a notification system—these small touches make the tool feel more intuitive. The organized file and layer structure in this set means you can hand the files to a developer or a designer and they will find what they need quickly.
Scenario 4: An educator preparing course materials
Teaching big data concepts to students or professionals requires clarity. An instructor building a slide deck for a data engineering course can use line icons in the reading materials, solid icons in the quiz interface, and flat color icons in the summary slides. The consistency across styles helps students associate each visual with a specific concept, reinforcing learning.
Who Benefits Most from This Icon Set
Different users will find different value in this set. Here is how various roles might approach it.
UX and UI designers appreciate the editable vector files. They can tweak colors, adjust stroke weights, and align the icons with an existing design system. The organized layer structure saves time, especially when working under tight deadlines.
Content creators and marketers value the ready-to-use PNG files. They do not always have access to design software, but they need visuals that look professional. Dropping a PNG into a blog post or a social media graphic takes seconds.
Product managers and business analysts care about clarity. They need icons that communicate technical ideas to non-technical stakeholders. The three styles give them flexibility to adapt the same icon to a slide, a document, or a prototype without inconsistency.
Developers working on data platforms or dashboards benefit from the SVG format. SVG files scale perfectly across devices and screen sizes. They also integrate neatly with modern front-end frameworks. If you are building a data visualization interface, the solid and line styles work particularly well for UI components.
Practical Considerations Before Using the Set
No icon set is perfect for every situation. Here are a few things to keep in mind.
Consistency matters more than variety. With 25 unique icons, you have coverage for common big data concepts. But if your project requires highly specialized visuals—for example, a specific database logo or a custom illustration of a machine learning pipeline—you might need to supplement the set with additional elements. That is normal. The strength of this set is that it covers the core concepts in a cohesive style, so you can build around it.
Flat color icons may need palette adjustments. While the flat color style is designed to be visually appealing, the default colors might not match your brand guidelines. Because the files are fully editable, you can adjust the palette. This takes only a few minutes in any vector editing software.
Line icons work best at medium to large sizes. If you plan to use line icons at very small dimensions, test them first. The thin strokes might lose visibility on screens with low resolution. In those cases, the solid style is a safer choice.
File format matters for your workflow. If your team primarily uses Figma or Sketch, you might prefer SVG files. If you work with Adobe Creative Suite, the AI and EPS formats give you full control. The PNG files are a fallback for quick use, but they are not editable. The set covers all these bases, so you are unlikely to hit a format barrier.
What Makes the Organized Structure a Practical Advantage
You might not think about file organization until you are in the middle of a project, searching for the right icon among dozens of unlabeled files. This set avoids that headache. Each icon is stored in a logical structure, grouped by style and concept. If you need the line version of the data analytics icon, you know exactly where to find it. This sounds small, but when you are working under pressure, it saves real time.
The same applies to layer organization inside each file. Layers are named clearly, so you can edit individual elements without hunting through unnamed groups. Designers who work with complex files will appreciate this attention to detail.
Final Observations on Using Big Data Icons
Icons are one of those resources that you do not notice when they work well, but you definitely notice when they are missing. A presentation full of text feels heavy. A dashboard without visual cues feels confusing. An infographic with mismatched icons feels unprofessional. A dedicated Big Data Icons Set removes those pain points before they arise.
Whether you are building a pitch deck, a product interface, an educational module, or a marketing asset, the combination of three styles, multiple formats, and organized files gives you a foundation that adapts to your context. You do not have to compromise between aesthetics and functionality. The icons are designed to serve both.
When you download this set, you are not just getting 25 icons. You are getting a toolkit that fits into your existing workflow, reduces friction, and helps you communicate ideas that are inherently complex. That is the kind of resource that makes a real difference in day-to-day work.