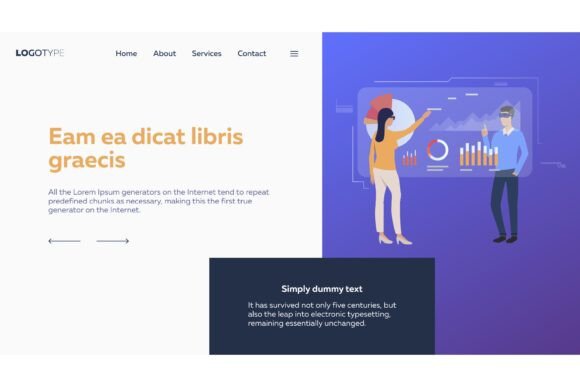
Colleagues Working on Virtual Charts: A VR Snapshot of Tomorrow's Teamwork
You have probably seen the image. Two colleagues, wearing sleek VR headsets, gathered around a luminous, floating chart. They are pointing at data points, discussing trends, and shaping strategy in an environment that looks part boardroom, part science lab. This vector illustration isn't just concept art. It is a surprisingly accurate forecast of how teams are beginning to handle their most complex asset: data. The days of static PDFs and cramped Zoom screen shares are giving way to an immersive, spatial approach to decision-making.
The concept of colleagues working on virtual charts in VR represents a fundamental shift in collaboration. It moves data from the flatland of a monitor into a shared, three-dimensional space. When you can walk around a revenue forecast or reach out and touch a churn spike, the discussion changes. It becomes tactile. It becomes obvious. Let's explore exactly where, why, and how this technology is taking root, and what it means for your workflow.
What the Image Gets Right About Modern Collaboration
The vector illustration focuses on a specific moment of synergy. One colleague is pointing, the other is observing. They are both present in the data. This is the core promise of VR business tools. It solves the "one person drives, everyone else watches" problem of traditional remote meetings. In a virtual chart room, every participant has agency. They can zoom in on their own areas of interest, pull up supporting data, and contribute organically without stepping on each other's toes.
This isn't about replacing face-to-face interaction. It is about enhancing digital interaction to a point where distance becomes irrelevant. The technology has matured enough that the "wow factor" fades quickly, revealing a genuinely useful workspace. For teams drowning in dashboards and spreadsheets, this offers a lifeline to clarity.
1. The Monthly Business Review Across Time Zones
Imagine a distributed leadership team. The CFO is in London, the CMO in Singapore, and the COO in Denver. Every month, they review the same dataset. In a traditional video call, the CFO shares their screen. It is a static experience. In a VR environment, they all enter a shared space. The revenue chart is a massive, interactive structure in the center of the room. The CFO can highlight a dip in European sales, and the CMO can instantly pull up the campaign data that correlates with that dip. The discussion flows naturally, visually, and much faster than any slides deck allows. The outcome is a quicker, more nuanced strategic decision grounded in a shared visual reality.
2. The Startup Pitch That Demands Immersion
Investors see hundreds of pitch decks. They blend together. An entrepreneur using a VR data room changes the dynamic entirely. Instead of showing a bar chart on a slide, they invite the investor to stand inside the market opportunity. Projected growth curves become paths you can walk along. Competitive landscapes become territories you can survey from above. The investor does not just hear the story; they experience the data firsthand. This deepens engagement and creates a memorable connection to the business model that a standard PDF simply cannot deliver.
3. Teaching Complex Systems in Higher Education
Supply chain logistics, epidemiology models, and network architecture are inherently spatial subjects. A professor can load the entire global supply chain of a product into a VR space. Students, wearing headsets, can walk from the raw material source to the factory to the distribution center. They can see the bottlenecks. They can tweak a variable, such as a port closure, and watch the entire system ripple in real-time. The abstract concept becomes a concrete, explorable landscape. Retention and understanding improve measurably compared to a static diagram on a whiteboard.
4. The Freelancer's Personal War Room
Working solo has its challenges, one of which is constant context switching. A freelancer juggling multiple clients can benefit enormously from a personal VR dashboard. They can arrange virtual charts for each client's KPIs, their own financial tracking, and their project timelines all in one expansive, custom space. Instead of tabbing between windows, they look from one interactive chart to another. This creates a deep focus environment that the typical home office or co-working space cannot replicate easily.
5. The Personal Analytics Environment for Health Enthusiasts
Beyond business, individuals tracking complex personal data—sleep patterns, heart rate variability, nutrition, and cognitive performance—can build a VR dashboard to spot hidden correlations. Seeing your sleep score and your HRV plotted together in a 3D space over a month reveals connections that a phone app screen cannot. It turns personal data into an immersive research project, helping biohackers and health enthusiasts make better decisions about their routines.
6. The Creative Sprint for Campaign Planning
A creative team tasked with a massive product launch can use VR to map the entire campaign ecosystem. The central product is a sphere. Outward arcs represent social, email, print, and video channels. Each node contains performance projections and content drafts. The team can physically walk around the map, identifying gaps in the customer touchpoint flow. It turns a dry content calendar into an interactive strategic sculpture. This practice is already being adopted by forward-thinking agencies looking to break out of linear document thinking.
Who Benefits Most from Virtual Chart Collaboration
While it might seem tailored for data scientists, the benefits span across nearly every role. Project managers can visualize slippery timelines and resource allocations in a way that feels intuitive. Marketing teams can map complex customer journeys and attribution models as a explorable network. Creative directors can review content ecosystems in a spatial layout, spotting inconsistencies immediately. Even executives who rarely touch raw data find value in seeing the "shape" of the business during quarterly reviews. The common thread is a need for shared understanding in a complex information environment.
For the Solopreneur: VR charts offer a way to step back and see the "big picture" of your business without the clutter of your inbox or the distraction of your phone. It is a dedicated space for deep thought and strategic overview.
For the Marketer: Moving beyond linear funnels becomes possible. Seeing the entire customer lifecycle as a dynamic, interconnected system helps identify hidden leverage points and drop-offs that a flat dashboard might obscure.
Practical Questions Before You Commit to the Space
The vector art is aspirational, but the execution requires planning. Before you buy a fleet of headsets, consider these factors carefully:
- Hardware Access and Comfort: Not everyone enjoys wearing a headset for an hour. The Apple Vision Pro offers high resolution, but the Meta Quest 3 is more accessible and affordable. Test for motion sickness and eye strain with your team. The best headset is the one your team will actually tolerate for a working session.
- Collaboration Etiquette: Virtual spaces require new social norms. How do you politely get someone's attention? How do you share a specific view? Setting ground rules for the VR meeting prevents it from feeling chaotic or impersonal.
- Data Security and Privacy: If you are reviewing sensitive financial or customer data in a VR platform, you must verify its security protocols. Not all platforms are designed for enterprise-grade compliance or data encryption. Do your due diligence.
- The Learning Curve: Navigating a 3D space and manipulating virtual charts with controllers or hand tracking takes practice. Do not expect peak productivity on day one. Schedule a few low-stakes sandbox sessions first to build comfort and familiarity.
- Platform Lock-In: Be mindful of building your entire workflow inside one closed ecosystem. Ask about data exportability. Can you bring your charts to another platform if needed? Standardization is still emerging in this space, so flexibility matters.
- Accessibility: Consider team members with disabilities. VR relies heavily on motion and vision. Look into platforms that offer alternative control methods or non-VR participation options to ensure inclusivity for the whole team.
Taking Your First Step into the Virtual Chart Room
You do not need a custom software development budget to start. Platforms like Spatial, Frame VR, and Microsoft Mesh offer ready-made environments for collaboration. You can import your existing data visualizations from tools like Tableau or Power BI directly into these spaces. Start with a single use case, such as the weekly team sync or a monthly review. Gather feedback on the experience. The goal is not to replace all screens, but to use spatial data visualization when it offers the clearest advantage: complex analysis, collaborative problem-solving, and immersive storytelling.
The Real Outcomes of Shared Virtual Data
When colleagues work on virtual charts in VR, the tangible result is better decisions made faster. The traditional hierarchy of the conference room dissolves. The junior analyst's insight is just as visible as the CEO's directive. Everyone can point to the same anomaly, walk through the same projection, and arrive at a consensus grounded in a shared visual experience. This is the future of work that the vector illustration hints at. It is not about escaping reality. It is about making reality easier to understand, together.
So, look at that image again. See beyond the sleek aesthetics. See your next project meeting, your next strategic pivot, or your next breakthrough insight. The space is ready. The data is waiting. It is time to step inside and experience how immersive collaboration can actually improve the way you work.