Transforming Business Data with the Break Slide Template: A Visual Design Framework for Impactful Presentations
In the modern professional landscape, data is abundant, but attention is scarce. The challenge is not merely collecting business metrics, but presenting them in a way that resonates, clarifies, and drives decisions. The Break Slide Template emerges as a design solution specifically crafted to bridge this gap. It redefines how professionals approach data visualization and presentation design, moving beyond static slides to create a dynamic narrative experience. This article explores how the Break Slide Template functions as a strategic asset for business communication, examining its visual architecture, practical advantages, and real-world applications across diverse professional contexts.
Redefining Data Presentation: From Static Numbers to Visual Stories
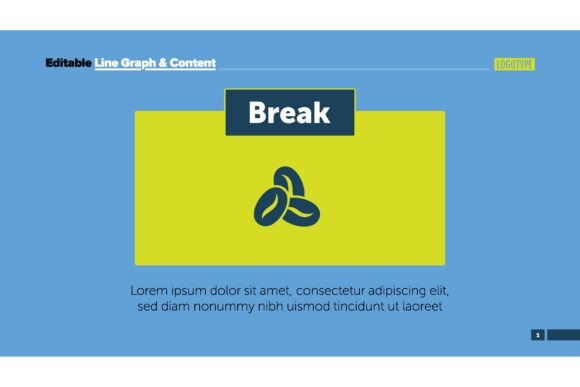
Traditional presentation tools often treat slides as containers for raw information. Tables, bullet points, and dense charts dominate the screen, leaving audiences overwhelmed rather than informed. The Break Slide Template challenges this convention by embedding design thinking directly into the slide structure. It treats each slide not as a data dump, but as a visual break point—a moment where the audience can pause, absorb, and connect with the underlying narrative.
The template achieves this through a carefully calibrated layout that balances negative space with focal elements. Data points are not isolated; they are positioned within a visual hierarchy that guides the viewer's eye naturally. Color palettes, typography scales, and iconography are pre-configured to reduce cognitive load while maintaining professional polish. This approach is especially valuable when dealing with complex business data sets, such as quarterly revenue breakdowns, operational dashboards, or competitive analysis matrices.
One of the core innovations of the Break Slide Template is its ability to integrate infographic-style elements without sacrificing readability. For instance, a data set showing customer acquisition costs across channels can be transformed into a series of interconnected visual blocks, each representing a channel's performance relative to others. The viewer immediately grasps trends and outliers without needing to decode a spreadsheet. This visual logic makes the template particularly effective for managers and executives who need to absorb insights quickly during time-constrained meetings.
Characteristics That Define the Break Slide Template Experience
Understanding what makes the Break Slide Template distinct requires examining its core design characteristics. These are not arbitrary aesthetic choices but intentional decisions that enhance communication effectiveness.
- Modular Layout Structure: The template uses a grid-based modular system that allows presenters to mix text, imagery, charts, and callout boxes seamlessly. Each module can be independently resized or repositioned without breaking the overall visual harmony.
- Contextual Color Coding: Rather than using color decoratively, the template applies color to signify meaning—positive vs. negative trends, primary vs. secondary data, or category groupings. This reduces the need for excessive legend explanations.
- Typography Hierarchy: Headings, subheadings, data labels, and annotations are styled with clear size and weight distinctions. The eye moves from macro insights to micro details in a controlled sequence.
- Integrated Chart Templates: Common chart types—bar, line, pie, scatter, and waterfall—are pre-designed to match the template's aesthetic. Data updates automatically flow into the visual structure, minimizing manual formatting.
- White Space as a Design Tool: Empty space is deliberately preserved around key data points. This prevents visual fatigue and makes each numerical or textual element stand out with greater impact.
These characteristics collectively create a Break Slide Template experience that is both versatile and consistent. Whether the presentation covers a weekly sales performance review or a long-term strategic roadmap, the visual language remains cohesive, reinforcing brand identity and professionalism.
Practical Advantages for Professionals and Teams
The Break Slide Template offers tangible benefits that extend beyond surface-level aesthetics. For professionals who regularly create presentations—consultants, analysts, marketers, educators, and executives—the template addresses several pain points inherent in traditional slide design.
Time Efficiency: Designing presentation slides from scratch consumes hours of effort. The Break Slide Template provides a pre-structured environment where content can be inserted and immediately visualized. Data updates are handled through consistent formatting rules, so changing a single metric does not require rethinking the entire layout. For teams producing weekly or monthly reports, this efficiency translates into faster turnaround times and more consistent output.
Audience Engagement: Static slides often lead to passive listening. The Break Slide Template encourages visual breaks—points in the presentation where the slide itself tells a story. For example, a sequence of slides showing revenue growth followed by a slide that breaks down cost structure creates a natural rhythm. The audience's attention resets with each new visual perspective, reducing the likelihood of disengagement during longer presentations.
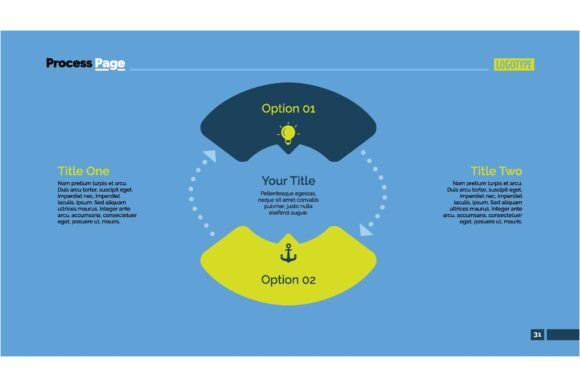
Data Clarity: Complex business data—such as cohort analyses, multi-dimensional benchmarks, or flow metrics—can be difficult to communicate clearly. The template's infographic-friendly design allows presenters to layer information visually. A single slide can show a central metric surrounded by contributing factors, each represented with icons, mini-charts, or callout numbers. This visual layering helps audiences understand not just what the data shows, but why it matters.
Cross-Platform Consistency: Presentations are often shared across devices, projected in conference rooms, or exported to PDF. The Break Slide Template maintains visual integrity across formats. Fonts, colors, and alignment remain stable, ensuring that the intended message is not lost due to technical discrepancies.
Applications Across Diverse Professional Contexts
The versatility of the Break Slide Template makes it suitable for a wide range of use cases. Its design language adapts to different industries and presentation scenarios without feeling out of place.
Corporate Rest Day Roundups and Operational Reviews
In fast-paced corporate environments, teams need to recap daily or weekly performance quickly. The Break Slide Template allows for a standardized format where key metrics—revenue, user activity, support tickets, inventory levels—are displayed in a consistent visual layout. Each metric block can include a trend arrow, percentage change, and a short annotation. This structure enables leadership to scan the entire review in minutes rather than wading through paragraphs of text.
Insightful Meeting Reports and Strategic Discussions
Board meetings and strategy sessions often involve dense information sets: market research findings, competitive intelligence, or investment scenarios. The Break Slide Template transforms these into digestible visual summaries. A competitive landscape slide, for instance, can use positioned bubbles of varying sizes to represent market share, with color coding for growth rate. The audience can immediately identify which competitors are gaining or losing ground.
Innovative Design Projects and Creative Pitches
Creative teams and agencies benefit from the template's balance between structure and flexibility. When presenting design concepts, user research insights, or A/B test results, the slide layout can incorporate wireframes, mood boards, or annotated screenshots alongside data points. The visual break concept ensures that each idea gets its own moment of focus, preventing information overload during client presentations.
Educational Seminars and Training Sessions
Educators and trainers often face the challenge of making data accessible to learners with varying levels of expertise. The Break Slide Template's infographic approach helps simplify complex concepts. For example, a slide explaining customer lifetime value calculations can show the formula visually, with each component broken into a separate block and linked by arrows. Learners can follow the logic step by step, which improves retention and comprehension.
Non-Profit and Community Reports
Non-profit organizations and community groups frequently present impact data to stakeholders, donors, or volunteers. The Break Slide Template helps tell a compelling story about outcomes—number of people served, funds raised, program reach. By presenting data in a visually engaging format, these organizations can communicate their mission more effectively and build stronger cases for support.
Integrating with Broader Marketing and Infographic Strategies
The Break Slide Template is not confined to live presentations. Its design principles extend naturally into marketing materials, infographics, and social media assets. For content marketers and communication teams, this means a consistent visual language can be maintained across multiple channels.
An infographic created using the same design DNA as the presentation template reinforces brand recognition. Key data points from a business report can be repurposed into standalone social graphics or one-page summaries. The modular nature of the template allows for easy extraction of individual slides to be used as email attachments or webpage visuals. This integration saves design effort and ensures that the audience encounters a unified visual identity whether they are viewing a slide deck, a blog post, or a printed hand-out.
Moreover, the template's emphasis on visual breaks aligns well with modern content consumption patterns. People skim and scan before they read thoroughly. Slides designed with clear visual hierarchy and intentional white space capture attention quickly, making them more likely to be shared or referenced. For businesses looking to improve their thought leadership content, adopting a design framework like the Break Slide Template can elevate the perceived quality of their materials.
Considerations for Effective Implementation
While the Break Slide Template provides a powerful foundation, its effectiveness ultimately depends on how it is used. Several considerations can help professionals maximize its potential.
- Tailor the Data Density: A single slide should not attempt to convey everything. Use the template's modular design to distribute information across multiple slides, each focused on one key insight. This respects the audience's cognitive capacity and preserves the impact of each visual break.
- Balance Visual Elements: Icons, illustrations, and color blocks enhance understanding when they directly support the data. Avoid decorative elements that distract from the metrics. Every visual component should have a functional purpose.
- Adapt to the Audience: A presentation for internal teams can afford more detailed data breakdowns, while a presentation for external stakeholders may require higher-level summaries and more explanatory annotations. The template can be adjusted accordingly by hiding or expanding detail blocks.
- Maintain Consistency Across Decks: If multiple team members create presentations using the Break Slide Template, establish a shared style guide. Consistent use of colors, font sizes, and icon sets preserves the professional look and avoids visual fragmentation.
- Test on Actual Projection Equipment: Screen sizes and resolution vary. What looks good on a laptop may appear cluttered on a large screen or washed out on a budget projector. Preview slides in the actual presentation environment to ensure readability.
Why the Break Slide Template Resonates with Modern Audiences
The contemporary professional audience is conditioned to process visual information rapidly. Social media, infographics, and mobile interfaces have trained people to expect clear, scannable content. The Break Slide Template aligns with this shift by prioritizing visual clarity and narrative pacing. It does not force the audience to work hard to extract meaning; instead, it presents insights in a format that feels intuitive and immediate.
This audience-centric design philosophy is what separates a forgettable slide deck from one that drives action. When business data is presented with the right balance of structure, emphasis, and visual appeal, it becomes a tool for persuasion and alignment. The template's ability to create natural break points—moments of reflection and comprehension—transforms a linear presentation into an interactive thought journey.
Furthermore, the template respects the presenter. By reducing the cognitive load of slide design, presenters can focus on delivery, storytelling, and audience interaction. The confidence that comes from well-designed visuals allows for a more relaxed and authoritative presentation style, which in turn enhances credibility and trust.
Looking Ahead: The Role of Design Templates in Data Communication
As data volumes continue to grow across industries, the need for effective visualization tools will only intensify. The Break Slide Template represents a step toward standardized, high-quality presentation design that bridges the gap between raw analytics and human understanding. Future iterations may incorporate interactive elements, real-time data feeds, or collaborative editing features, but the core principle will remain: business data deserves to be presented with intention and artistry.
Professionals who adopt such templates early gain a competitive advantage. They can communicate complex information faster, build stronger narratives, and leave a lasting impression on their audiences. Whether the context is a boardroom, a classroom, or a virtual meeting room, the ability to break down data into visual insights is an increasingly valuable skill.
Ultimately, the Break Slide Template is more than a design asset—it is a communication framework. It empowers professionals to respect their data, respect their audience, and respect the moment of shared understanding that a great presentation can create. By using its visual architecture thoughtfully, anyone can transform routine business reporting into an experience that informs, persuades, and inspires.