Strategic Clarity with Four Triangles Process Charts
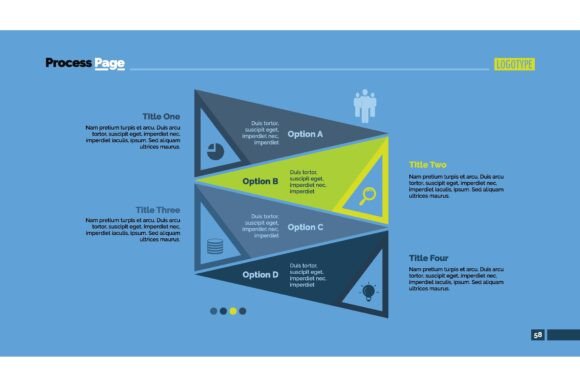
In the modern world of rapid data flow and information overload, the ability to distill complexity into a clear, actionable visual is a genuine competitive advantage. The Four Triangles Process Chart Slide Templ offers exactly this: a structured, aesthetically compelling framework for presenting interconnected ideas. It moves beyond simple bullet points or disconnected pie charts, inviting your audience into a dialogue of strategy and analysis. Whether you are mapping out a go-to-market plan or visualizing the pillars of a corporate strategy, this template provides a sophisticated yet intuitive container for your narrative. Its geometric foundation is not arbitrary—it is designed to imply movement, interdependence, and strategic balance.
The Power of Four: Why This Structure Resonates
The choice of four triangles is deeply rooted in how audiences process information. Cognitive research suggests that the human brain efficiently handles roughly four distinct chunks of information at once, making a quad-part diagram an ideal vessel for presenting manageable, memorable insights. Where the Four Triangles Process Chart truly excels is in its use of directional geometry. Triangles inherently convey momentum, hierarchy, and connection. Unlike static boxes or circles, they can point inward toward a shared goal, outward to external forces, or sequentially to illustrate a clear progression.
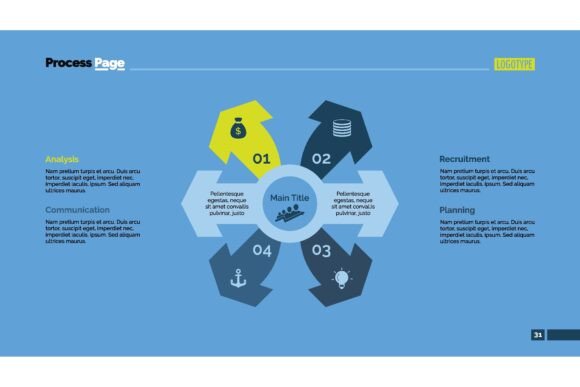
For a business strategist, this means you can take a complex SWOT analysis and present it not as a static list, but as a dynamic interplay. Strengths and Opportunities can form the upward momentum of the chart, while Weaknesses and Threats are framed as areas requiring careful navigation. The visual itself communicates the core message before the audience even reads the text. This blend of design and practicality makes it perfectly adapted for infographics and presentations where first impressions matter.
Practical Application: From Strategic Planning to Execution
Where this template truly shines is in the transition from high-level planning to ground-level execution. Consider a marketing director plotting an annual strategy. Instead of distributing a text-heavy document, they build their presentation using the quad-triangle structure to represent four core pillars: Brand Awareness, Lead Generation, Customer Retention, and Market Expansion. The triangular nature of the graphic naturally suggests that these are not isolated silos, but interconnected engines. Investment in Brand Awareness flows into Lead Generation, which fuels Retention, which provides the stability necessary for Expansion.
This interconnected visualization aids critical decision-making. If resources become constrained, the director can clearly see the downstream impact of reducing spend in one area. The chart becomes a strategic compass, not just a reporting tool. Similarly, imagine a boutique retail owner analyzing a difficult quarter. Instead of sifting through rows of data, they populate the template with four critical forces: Online Sales Growth, Foot Traffic Trends, Supply Chain Costs, and Customer Feedback. Placing these in opposing triangles highlights tension—such as rising online sales offset by supply chain inefficiencies—providing an immediate visual of where to focus next.
Optimizing Efficiency for the Time-Strapped Professional
For freelancers, educators, and small business owners, every minute spent on design is a minute taken from core business activities or creative work. The Four Triangles Process Chart Slide Templ eliminates the friction of starting from a blank canvas. It provides a polished, professional foundation that requires only your specific content and data to come to life. This efficiency gain is significant. Instead of fiddling with shape alignment, gradient consistency, and color matching, you are immediately in the flow of content curation and narrative building.
This dynamic generates high-quality output in a fraction of the time, allowing you to maintain a professional standard without sacrificing your schedule. In an era of asynchronous remote work, this template also becomes a powerful communication anchor. A project lead can record a brief walkthrough video using the chart as a visual aid, creating a shared reference point that aligns team members across time zones without requiring a live meeting. The graphics manifest a creative blend of design and practicality, skillfully encapsulating concepts around analysis, strategy, and planning.
Who Benefits Most from the Four Triangles Framework?
Given its blend of strategic depth and visual elegance, this template is exceptionally well-suited for several key groups, each finding unique value in its structure:
- Consultants and Advisors: They live and die by the clarity of their communication. Using this chart to map out client strategies, competitive landscapes, or organizational change initiatives establishes immediate credibility and shared understanding. It helps simplify complex decisions for stakeholders.
- Marketers and Content Creators: From infographics to webinar slides, the ability to encapsulate a framework or process in a single compelling image is invaluable. It drives engagement and improves information retention on social media and blog assets, helping their data truly talk.
- Educators and Trainers: Complex theoretical concepts become tangible when visualized. A four-stage learning cycle or a four-pillar management principle is easily grasped when presented in such a direct, structured manner. This supports creativity in lesson design.
- Product and Project Managers: Roadmaps often suffer from overwhelming detail. A high-level strategic view, using the four triangles to represent major phases or objectives, provides clarity for stakeholders and helps align the team on the overarching mission without getting lost in tactics.
Ensuring the Right Fit and Avoiding Common Pitfalls
While the Four Triangles Process Chart is a powerful asset, it is not a universal key. Its strength lies in its structure, and that structure requires four distinct, yet logically connected, components. Trying to force a five-part journey or a simple two-part distinction into this frame can undermine the message it is trying to convey. Thoughtful implementation is crucial for maximizing its impact.
Here are a few guidelines to ensure you harness the power of engaging visuals effectively:
- Prioritize Connection: Ensure the flow between the four elements is logical. Is it a cycle (1 to 2 to 3 to 4 and back to 1)? A funnel converging to a center? A linear sequence? The arrows and layout should clearly support this relationship.
- Mind the Labeling: Keep text concise. Each triangle is a container for a core concept, not a paragraph. Use supporting footnotes or a complementary slide for deeper detail. Overloading the graphic defeats its purpose of simplifying information.
- Leverage Color Strategically: Use color to reinforce meaning. A gradient can show progression. Contrasting colors can show opposition or tension between internal and external factors. Applying color with intention strengthens the visual narrative.
- Test for Accessibility: Ensure high contrast between text and the triangle backgrounds. Consider adding simple icons alongside text labels to support comprehension for all audience members and ensure your presentation is inclusive.
Balancing Simplicity and Depth in Your Workflow
The beauty of a well-constructed template like this is that it allows you to hold multiple layers of information simultaneously. On the surface, it is a simple four-step or four-part graphic. For the engaged audience member, it becomes a map of your logic. The key to unlocking this depth lies in your accompanying narrative. The chart anchors the discussion, but your voice provides the context, data, and detail. This partnership between visual anchor and verbal explanation is at the heart of compelling presentations and strong business communication.
Integrating the Four Triangles Process Chart Slide Templ into your workflow is more than an aesthetic choice—it is a strategic decision to communicate with precision and impact. It respects the audience's time by distilling information into its most essential form, while providing the structural integrity needed for complex analysis. For professionals across marketing, strategy, education, and product development, this tool offers a reliable path towards more engaging presentations, clearer strategies, and ultimately, stronger outcomes. By purposefully aligning your data within this dynamic framework, you transform raw information into a story that sticks, guiding your audience toward action and shared understanding.